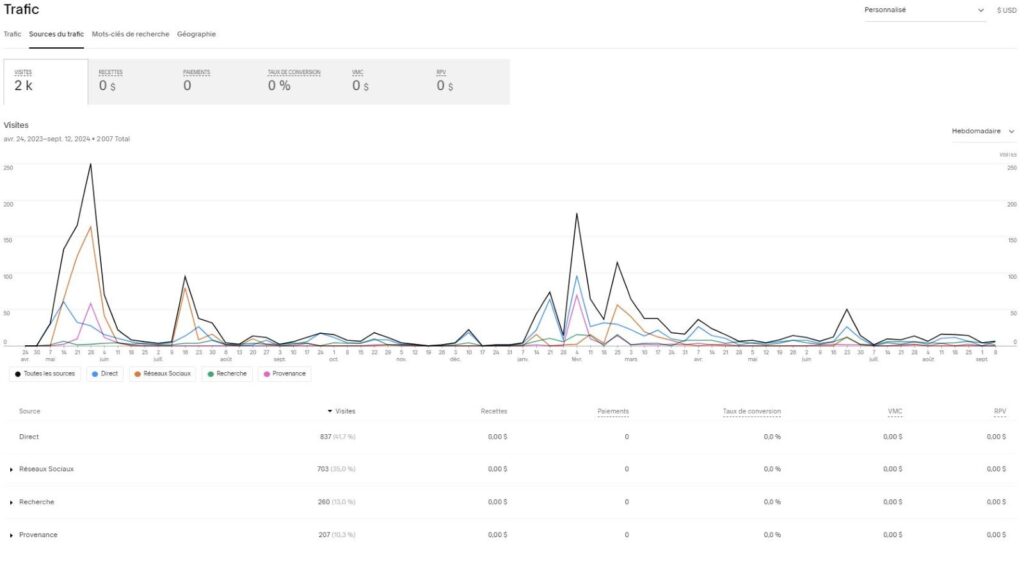
This graph is a representation of the amount of traffic on the website from its live date on 01st of May 2023 to the week of the 08th of September 2024 on a weekly basis.
The website totalize 2010 connections on this period and the visitors are spread all along these 17 month of analysis with a concentration around six peaks when the visitor number is equal or superior to 50 in one week.
The first peak is registered between the week of the 07th of May 2023 and the week of the 04th of June 2023 and represent a maximum of 250 connections on the week of the 21st of May 2023. The second peak is seen on the week of the 16th of July 2023 and represents 95 connections. The third, fourth and fifth peaks are registered between the week of the 14th of January and the week of the 03rd of March 2024 and represent respectively 73, 182 and 114 connections. The last peak is seen on the week of the 23rd of June 2024 and represents 50 connections.
The principal source of the traffic is from a direct connection, meaning that users are accessing the website from a direct typing of the address www.sogutorgin.is in their device, and it represents 837 connections. The second source of traffic is links on social media (facebook, Instapaper) and represents 703 connections. The third source of traffic is from a research on a browser (Google, Bing, Ecosia, Duckduckgo) and it represents 261 connections. The fourth source of traffic is the website of the municipality www.borgarbyggd.is. The last sources are other ways of arriving on the website and representing the last 209 connections.
The type of device used to visit the website is equally spread between mobile phones (947) & tablets (81) and computers (979).

This graphic represents the different sources of traffic of the website www.sogutorgin.is categorized into 3 groups: Blue line = direct connections, orange line = social media connections, green line = browser research connections, purple line = other provenance websites.
We can see that the most constant source of connection is direct connections throughout the time. However it is not the most impactful as it never reach a peak higher than 97 (week of the 04th of February 2024). On the contrary the second source of connection, social media, appears principally during the peaks of connections and disappears most of the time in between. It is the same with connections from a different provenance. A steady but very low one is connection with browser research although it never peaks.
We can see on this graph that connection to the website are not steady and principally appear in peaks and we can suppose hese peaks are linked to an exterior source of interest (event, publication, etc) creating a direct interest towards the website for users and/or a connection via social medias.
Geography
The 2010 connections on the website www.sogutorgin.is are coming from various places. The main origin of theses are obviously in Iceland with 1716 connections followed by Europe (France 34, Germany 26, Uk 17, Spain 16, Netherland 11, Sweden 10, Austria 7, Belgium 6, Finland 5, Greece 5, Denmark 4, Italy 4, Switzerland 2, Ireland 2, Norway 2, Poland 2, Portugal 2, Slovenia 2, Bulgaria 1, Estonia 1,) with a total of 159 connections, then the USA with 93 connections, Canada with 21 connections, and other countries all around the world with the remaining 21 connections.

Analytical tools from the facebook page Sogutorgin :
48 followers
33 likes
22 Publications
